
powerful software for cyclists
The goal of Cycling Analytics is to be the most insightful, most powerful and most user friendly tool for analysing ride data and managing training.
Here is what you need:

A bike
This one's important.

A power meter
Or a heart rate monitor.

A bike computer
Most devices are supported.
Here is what you get:

A clean interface to all your riding
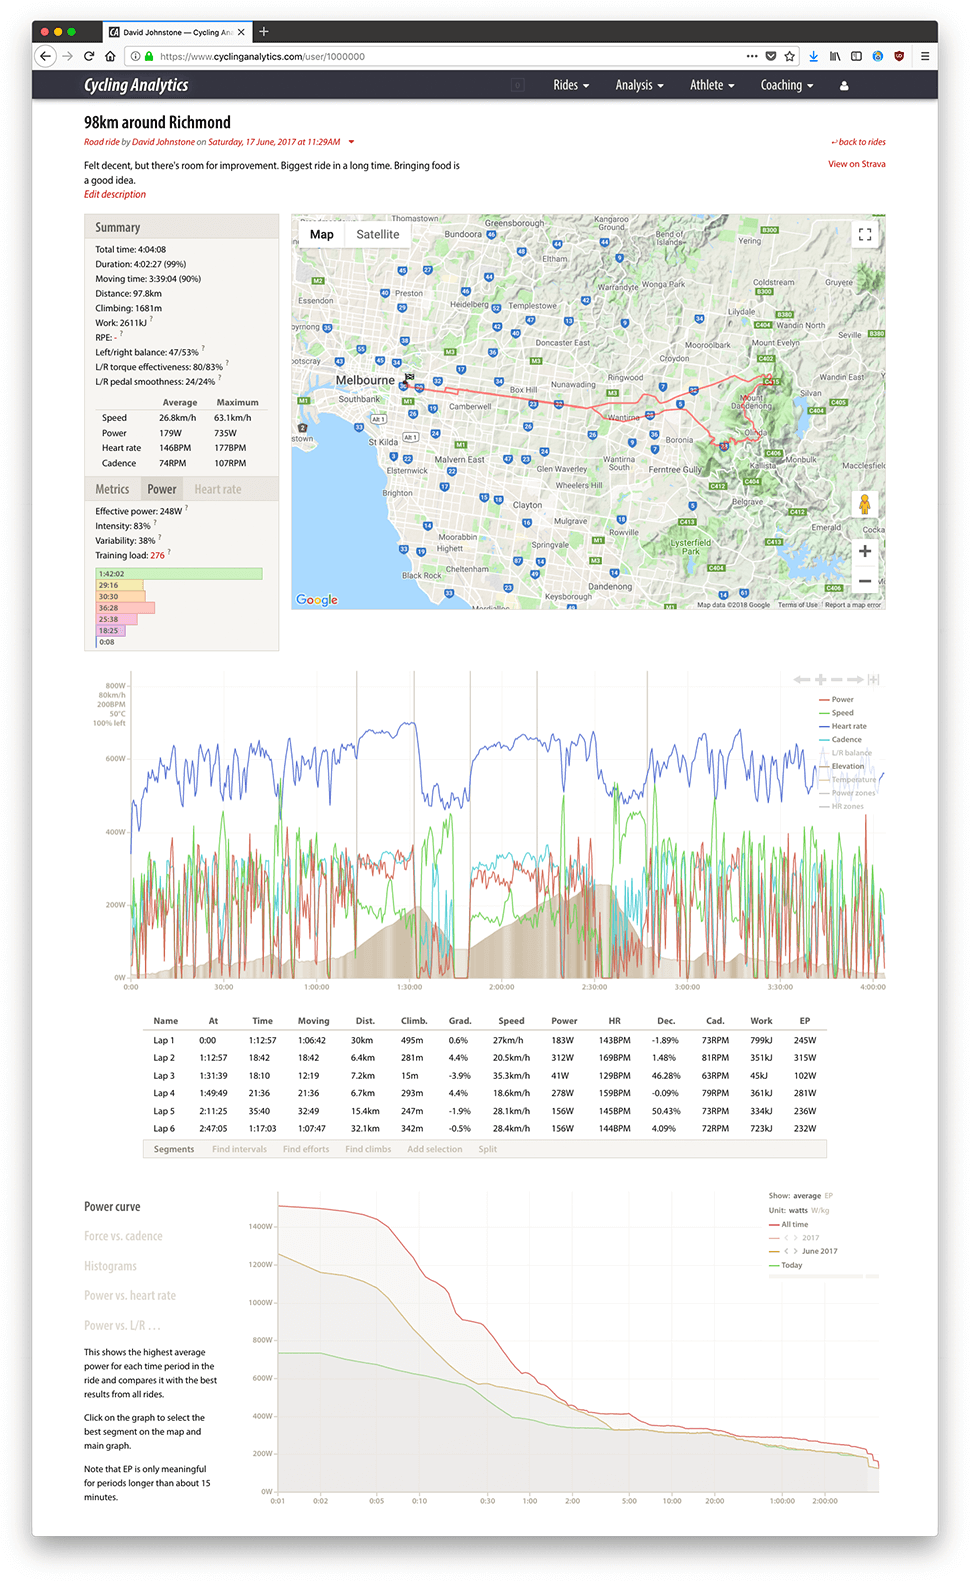
Powerful tools to analyse each ride
A chart that shows the relationship between pedal speed and pedal force.

Histograms for power, heart rate and cadence.

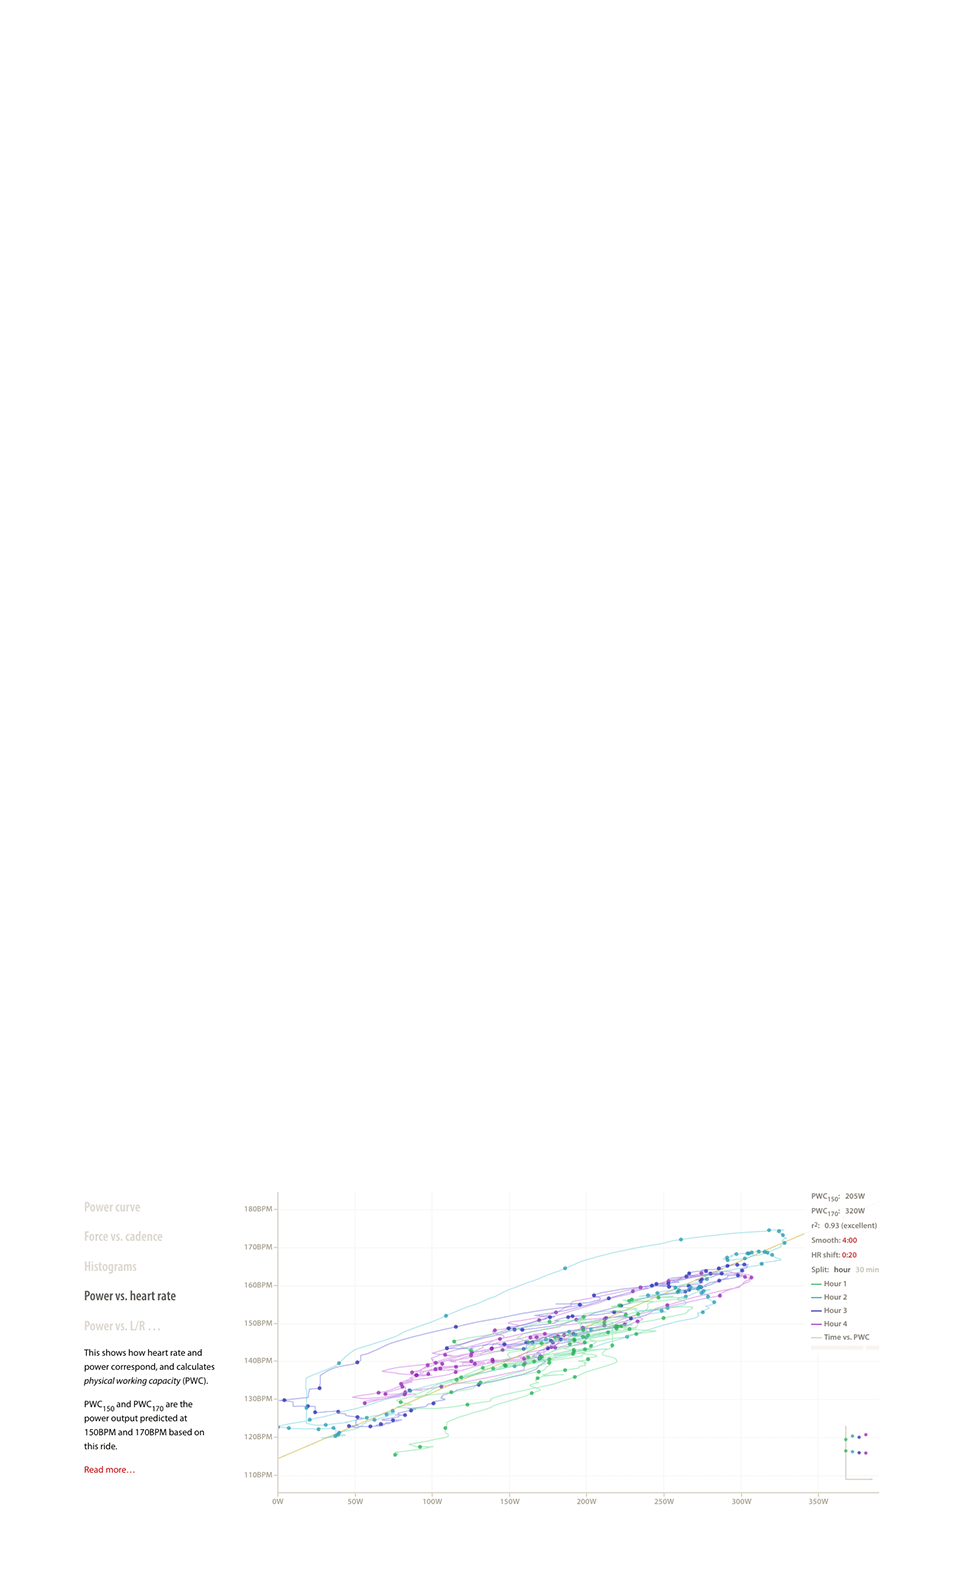
A chart that shows the relationship between heart rate and power.
A chart that explores the left and right leg power data.

And there's more:

Training load chart
Track how much you are riding, based on power or heart rate data.

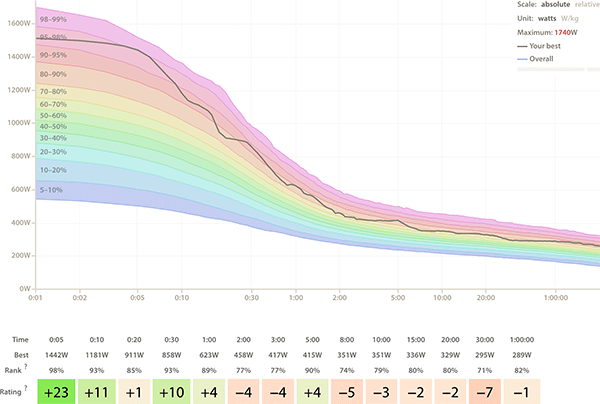
Power history
See how your best power outputs have changed over time.

Rides table
A searchable and sortable table for looking at ride data.

Zones chart
Track how much time you spend in power and heart rate zones.

Flexicharts
Create your own custom charts.
Comparative statistics
Compare yourself with everybody else who uses this.
And then there are things like training plans, the ability for coaches to link their account with their athletes' accounts, powerful and flexible privacy controls (it's possible to share your rides with others, but without power and heart rate data), the option to export all data uploaded in the original format, fully configurable heart rate and power zones, the ability to track the history of weight, FTP and resting and maximum heartrate, and, for developers, an API. Much more is planned for the future. Some of it may already exist — see the blog for the latest updates.
Here is what people say:
Best UX so far, clear and complete.
I'm a seasoned road cyclist who's new to training with power and eager to learn more. Cycling Analytics displays my data and provides well-written descriptions of what it all means and how it can be used in training. I've found it invaluable as a tool for tracking intensity, load and tapering for an event. Love the calendar format for getting a quick overview!
Not too complicated but easily powerful enough with some really thoughful features. It's my cycling life on a website - wherever I go.
Analysis and data at your fingertips. If you are self coached Cycling Analytics is an incredibly valuable resource. Its simple to use for the novice but the richness of the data and the statistical analysis it suitable for all classes of rider who like to analyse their performance.
All of the data you need to follow any training program at the best price online.
Cycling Analytics is a powerful and flexible analysis tool for both coaches and athletes. As a keen cyclist it allows me to track my performance, and drill down into specifics if I need to. As a coach it allows me to organise and plan for my athletes, enabling them to reach their potential as cyclists.
What do you want to do now?
Take a look at this in action
Here's a ride. Go there and click around and see what else this can do.
Create an account
Completely free for the first 30 days. Then A$10/month or A$80/year.
Try this out
Upload a ride without making an account and what this does with a single ride.