Ride cropping and data editing
26 September, 2012 by David JohnstoneSometimes the data you get from your bike computer isn’t quite right. Sometimes you’ll see massive power spikes, and — if you’re like me — occasionally you’ll forget to stop the device at the end of a ride or forget to reset it before the next ride. Therefore, you can now chop off the start or end of a ride, and also edit the raw data. The controls are located in the menu next to the date.

Ride cropping
Choosing Crop ride brings up something like the following, for a ride where I forgot to turn my bike computer off.
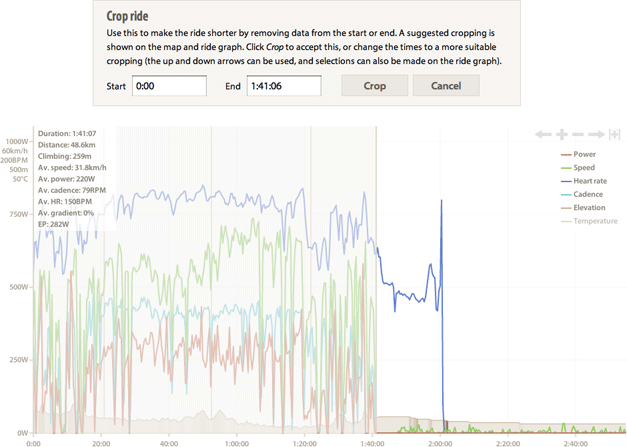
The selection shown is made automatically. It’s chosen so that it maximises the amount of not-very-useful data to remove, while minimising the amount of good data removed. The selection always starts at the start of a ride since it’s far more common to have unneeded data at the end of a ride than at the start. The way the initial selection is chosen has performed well in testing, so please get in contact if it doesn’t work as well as it could for you.
You can modify the selection in a few ways if you need to. You can manually edit the times in the start and end box. Alternatively, you can use the up and down arrow keys to change the times in the input boxes. Or, you can make a selection on the ride graph itself by clicking and dragging. (For the sake of completeness, you can also enter the selection in the URL or click on the power curve, but they’re not so useful here.) If the preset selection is wildly wrong, a sensible way to use this is to make a new selection with your mouse on the ride graph, then zoom in and use the up and down arrows keys to get it just right.
When you’re happy with the selection, click Crop and then only the given selection will remain of the ride.
Data editing
Choosing Edit data from the menu brings up an interface that allows for power, cadence, heart rate and speed to be modified for any records in the ride.

By default, the records for the top ten highest powers are shown (the highlighted rows), as well as records a few seconds either side to provide some context. The rationale behind this is that the most common reason to use this is because there are some artificially high power numbers that your power meter made up, so you want to remove them to make your power curve look correct again. To edit any of the values, simply click and edit them.
(By the way, power values greater than 2500W are set to 0W in the initial ride processing. I’m not sure that there’s anybody in the world that this would be a problem for, but get in touch if it is.)
Apart from showing the records that contain peak powers, all the records can be shown, or only the records that you have modified (that is, modified while on this page, not modified in the past; it’s a way of reviewing the changes you’re about to make). When you’re done, just click Save.
Reprocessing rides
One of the other options in the ride menu allows you to reprocess a ride. This allows you to undo all changes made to a ride in cropping and editing them, for it takes the original file and reprocesses that.
It’s not necessary to know this, but to explain, all rides that are uploaded are stored in their original format. (This is why it’s possible to download them all again.) They’re also processed and stored in a common format, and it is these processed ride files that are normally interacted with. Cropping and editing rides only changes the processed ride files, the original files are untouched. Therefore, reprocessing a ride reprocesses the original ride and resets the processed ride to be based on the original file.
Conclusion

Between the two functions of ride cropping and data editing, the two main data quality issues that are visible on the power curve can be fixed. At the top left there is a 1800W spike that shouldn’t exist, and can now be removed. At the bottom right there is a long tail of rides that go for tens of hours longer than they should, and these too can now be fixed.
This is the blog of Cycling Analytics, which aims be the most insightful, most powerful and most user friendly tool for analysing ride data and managing training. You might be interested in creating an account, or following via Facebook or Twitter.