Left/ride power balance metrics
11 September, 2013 by David JohnstoneJust in time for the Garmin Vector, Cycling Analytics now supports the left/right power balance metrics that some recent power meters produce.
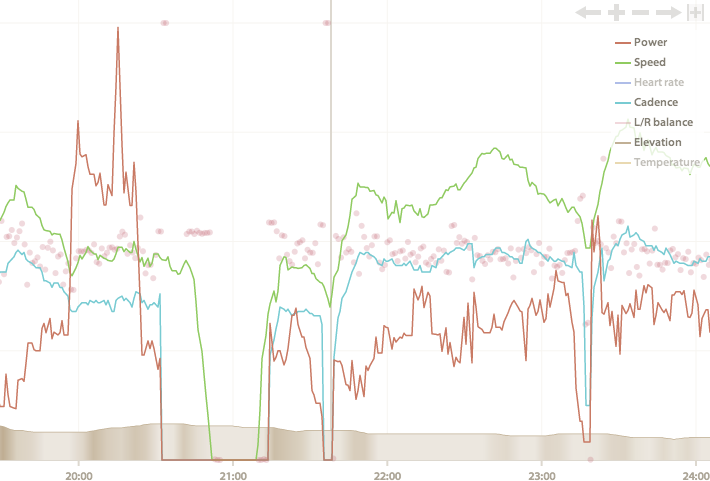
The left/right power balance appears in three places.
Firstly, there’s an overall left/right balance for the entire ride in the ride summary. However, it’s a bit like average power in that it means something, but there are many situations where it doesn’t say as much as it could.
Secondly, the main ride chart shows the power balance as points. You’ll first need to click “L/R balance” in the legend to make it visible. The average is also shown for selections when they are made. Note that the centre grid line is at 50%, and the percentage refers to the proportion of power coming from the left leg (so pedalling with only the left leg will result in points on the top of the chart).
Finally, there’s a power versus left/right balance chart at the bottom of the page. This is an x-y scatter plot that shows the power and power balance for each second of the ride. This is useful as it gives a better understanding of what your power balance looks like.

Rides that have been previously uploaded will need to be reprocessed for the left/right data to be included. For individual rides, this can be done from the drop-down menu next to the date. This will remove any data editing or cropping that you have done, so if you don’t want that to happen, let me know and I’ll sort something out. If you have lots of rides with power balance already, let me know and I’ll sort something out for you too.
This is the blog of Cycling Analytics, which aims be the most insightful, most powerful and most user friendly tool for analysing ride data and managing training. You might be interested in creating an account, or following via Facebook or Twitter.