Assorted updates
14 October, 2013 by David JohnstoneA variety of changes have happened recently. Highlights include improved summary data, UK units, power variability, power and heart rate zones charts in ride summaries, Flexicharts and API improvements, and account deletion. Read on for more details.
The way ride times are calculated has changed. Previously, there was duration and riding time, where duration was the length of ride from start to finish, and riding time was the time spent moving. These have been renamed to total time and moving time, and a new value called duration has been added, which is intended to be the best approximation of the actual length of the ride. Read How everything is calculated for more details about this and the rest of the summary data.
As a result of the ride duration changes, training load and TRIMP values have changed in some cases. When they have changed, they will be a few percent higher, and this in turn affects the numbers on the training load chart.
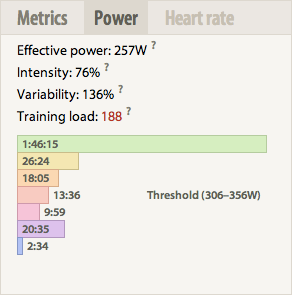
The variability of power output is now calculated and shown in ride summaries. As effective power takes high power outputs into account to work out a “this ride would be as hard as riding at this power continuously” figure, a ride with a constant average power will have the same effective power, but the more varied the power output, the higher the effective power will be relative to the average power. Consequently, variability is defined as effective power / average power, where a value of 100% requires a perfectly constant power output, and higher values will be seen when the power output is more variable.
The other change in ride summaries is that the heart rate and power zones are now displayed as a chart instead of a table. Moving the mouse over the chart shows information about each zone.

The new values, total time, duration, moving time and variability, in addition to temperature data (minimum, maximum and average) are also available in the API and on Flexicharts.
The other Flexicharts update is that it’s now possible to easily create x-y scatter charts by providing the axis to use for the data source:
rides.load('x').duration('y')
Previously, all data sources were only able to set the y value, and the x value was always the date. (It was previously also possible to create x-y scatter charts with map, but that was a lot more complicated.)
There is now a UK option for units, in addition to the existing metric and US options. UK values is the same as metric, except for distances, which are displayed in miles, and speed in miles per an hour. Elevations are still displayed in metres.
Because of the technology stack this site is using, and because of how ride uploads are currently handled, the processing of a ride after uploading must always complete within thirty seconds. As this is sometimes a limitation, there is now a temporary special uploading page that avoids the thirty second limit. The main ride uploader will soon be rewritten to make use of this new method.
There are also API methods to use to asynchronously upload rides. This new method saves the ride file immediately without processing it, and then offloads processing to a background worker. As a result, the upload method is unable to return a summary of the ride — instead it returns an upload_id which can then be queried for the processing status, and the ride_id once processing has completed.
Previously, rides being displayed have been limited to only showing the first 30 hours of the ride due to some technical limitations. These have now been worked around, so those of you who go for 1200km rides that take a few days can see your entire rides.
It’s now possible to delete accounts, which results in the permanent and unrecoverable deletion of all data. This can be done on the profile settings page.
Finally, there’s finally a Facebook page.
This is the blog of Cycling Analytics, which aims be the most insightful, most powerful and most user friendly tool for analysing ride data and managing training. You might be interested in creating an account, or following via Facebook or Twitter.