Seven not-so-obvious features
21 October, 2013 by David JohnstoneThe “selection” concept

On a “ride” page, a selection can be made on the main ride chart by clicking and dragging. This shows a summary of the selection, but this “selection” is shared across the entire page and used in a number of ways:
- The selection itself and summary statistics are shown on the ride chart.
- The path on the map turns blue.
- Histograms are shown for the selection.
- The selection is indicated in red in the power vs. cadence chart.
- The URL has a fragment like
#24m31s-29m13sappended. If this URL is directly visited, the selection is made when the page loads.
There are also a number of ways to create a selection:
- Clicking and dragging on the ride chart.
- Clicking on a lap selects the lap.
- Clicking on the power curve selects the part of the ride where the highest average power was sustained.

By the way, the fifth button in the main ride chart legend is the “zoom to selection” button. It might be useful.
How the summary numbers are calculated
If you want to understand why there are three different durations for rides and lots of other details, all is explained here.
Delete, edit and crop ride

There’s a drop down menu at the top of each ride page next to the date that provides options to delete and edit rides. In the “edit” page, it’s possible to edit individual values in the data file (the main use is for removing spurious high power readings, because most 2000W readings have more to do with misbehaving equipment than athletic ability) and delete entire data streams (for example, if your heart rate monitor is misbehaving the entire ride, all heart rate data for the ride can be deleted).
Also, the ride date and time can be changed by clicking on it and providing a new value. In fact, any text that is red can be clicked on. The training load and TRIMP values can be modified too.
Read more about ride cropping and data editing.
Training load data source
The training load chart can display data based on power, heart rate, or both. Where possible, it uses power data, but if you sometimes only have a heart rate monitor it will scale your TRIMP values to fill in the gaps. This is possible because there’s normally a high correlation between the power and heart rate based metrics for training load. The bottom of the training load page explains more, and note that this requires that you have a handful of rides with both heart rate and power. If there are no rides with power, then the training load chart will show heart rate (TRIMP) data.
Main ride chart y-axis
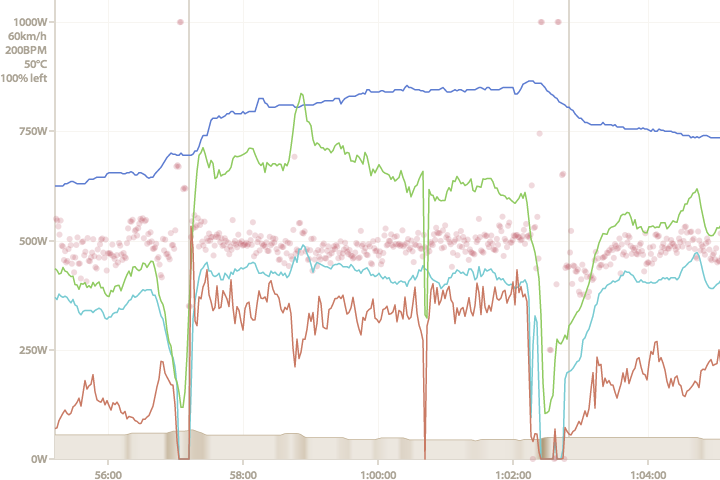
There aren’t as many labels on the y-axis of the main ride chart as there could be. However, there are a few things worth noting that could make reading this chart a bit easier.
The y-axis is always divided into quarters with the gridlines. The top one of these is labelled (where appropriate) with the power, speed, heart rate (and cadence, they share the same scale), temperature and left/right balance. The other gridlines are only marked with power (or speed, if there is no power data), but, given that the baseline is zero for power, speed, heart rate, cadence and often temperature (unless there are temperatures below zero, or you’re not showing metric units) a bit of mental arithmetic can easily derive the missing labels — when the maximum heart rate is 200BPM, the unlabelled gridlines will be 150BPM, 100BPM, 50BPM and 0BPM. If you can use this website, you probably won’t find dividing some numbers by four particularly difficult (and the numbers are always “nice” numbers to divide by four).
Elevation is handled in its own way. The main thing to note here is that the range shown by the y-axis will always be 500m, 1000m, 2000m or 3000m, and the minimum and maximum values are then chosen accordingly. This is to keep the scale as consistent as possible and to prevent rides that are basically flat from looking the same as a day in the mountains.
Full screen charts and other niceties

The solid grey bars at the bottom of the legends of most of the charts have a purpose. Occasionally the legend gets in the way of the data being displayed, so the bar on the left can be clicked to collapse the legend, or simply dragged out of the way. On the right, there is a menu that allows the chart to be shown full screen, and shows a PNG image of the chart (in case you find right clicking and saving an image easier than taking a screen shot, although note that some text, like the legend, isn’t shown on the PNG at the present time). All the charts will have these options eventually.
Width of ride page
The pages of this site are designed to work with a browser width of 960 pixels. However, if your browser is wide enough, the “ride” page will expand to be 1200 pixels wide. It’s possible that the entire site will move to a 1200px wide layout eventually…
That’s all that I can think of. Have I missed any?
This is the blog of Cycling Analytics, which aims be the most insightful, most powerful and most user friendly tool for analysing ride data and managing training. You might be interested in creating an account, or following via Facebook or Twitter.