Facebook integration
15 June, 2012 by David JohnstoneCycling Analytics can now post your rides to Facebook when you upload them. It doesn’t spam your wall with links to this site; rather, once activated, it leaves a box like the following at the top of your Timeline:

To get this you just need to connect your Facebook account to your Cycling Analytics account. Go to the Linked accounts page under Account and click Connect in the Facebook box. A Facebook page will then appear asking for your permission for Cycling Analytics to post to your Timeline. Once connected, rides will be automatically posted to Facebook as you upload them. You should also click the button to post to Facebook all your rides that you have already uploaded. This ensures that the historical aggregations that Facebook shows are complete.
The box that is shown on your Facebook Timeline is an aggregate (well, two aggregates) of the data you have posted to Facebook for the current time period. It normally shows your last ride and how many kilometers you have ridden this month, although it seems to require multiple rides in the current time period before it shows the last ride. I haven’t quite worked out how Facebook chooses to display what it does.
Next up on the list of things to do related to sharing rides is… continue reading
Watts/kg on the power curve
14 June, 2012 by David JohnstoneIt’s now possible to see your power as watts per a kilogram on the power curve.

You’ll first want to add your weight, and then you can click on the W/kg button at the top right of the graph and the values are shown as watts per a kilogram. This doesn’t yet support different weights over time, so old powers won’t be shown accurately if your weight has changed much.
Note: If you’re looking for a lot more information about what power outputs are typical or what counts as good, check out “How does your cycling power output compare?”.
Your password is secure
14 June, 2012 by David JohnstoneWith the recent hacks of LinkedIn, Last.fm and eHarmony that resulted in millions of passwords being stolen, now seems like a good time to say something about password security. I’m going to spend the rest of this blog post saying that passwords stored here are about as secure as they can be.
When you log into this website you provide an email address and a password to the server. The server then looks up the user with that email address, and then checks to see if the password is correct. This is where it gets tricky. The simplest way of doing this is by storing the password in the database, which makes checking the password when logging in trivial, except this means that all the passwords are sitting there in the database, and if anybody gets access to the database they can steal everybody’s passwords. Hopefully no unauthorised people get access to the database, but it can happen (just ask LinkedIn). The worst thing about having a password stolen is that people are lazy and reuse the same passwords, so once you have their LinkedIn password, you might also have their Facebook, email and online banking password.
Therefore, instead of storing the password itself in the database, the password is normally put through what’s called a cryptographic hash function which takes some input and always produces the same output given the same input, but it’s impossible to look at the output and work out what the input is. It turns a password like “bubbles” into “fe75bd065ff48b91c35fe8ff842f986c”, and that hash is stored in the database. Then, when somebody tries to log in, the password they entered is hashed and the two hashes are compared.
Using a hash function is all well and good, except it’s still possible to work out what somebody’s password is by putting lots of potential passwords through the hash function and seeing if any give the hash we’re looking for. This is a problem because computers are fast. It depends on which hash function is being used, but you can often test hundreds of millions of passwords per a second on a modern computer. And since a lot of people tend to use the same patterns when creating passwords, it’s possible to cut down the number of passwords you have to check dramatically by being smart — start with… continue reading
Hidden locations
31 May, 2012 by David JohnstoneIf somebody looks at the GPS data from a ride you did, they’ll be able to see exactly where you started and finished, and that will often be where you live. So, in the name of privacy, you can now provide addresses and no GPS points will be shown that are near that address.
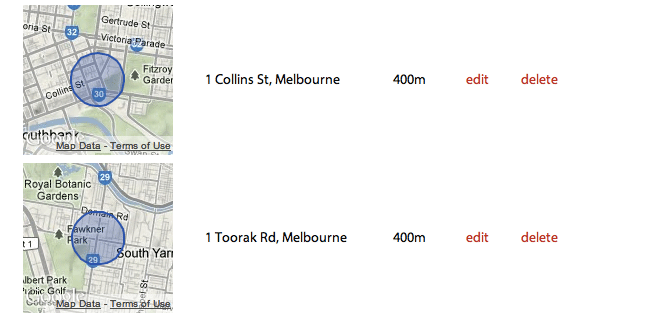
Users can go to the privacy settings page (it’s one of the pages under Account) and add whatever locations they wish to hide. GPS points are only hidden from other users, so don’t worry if you go to one of your rides and can see points that should be hidden. If you want to make sure it’s working, copy the URL of a ride and go to it after you log out (you can also share rides with others by sharing the URL).
One known issue with this is that if you go for a ride entirely in a hidden area (like what you might do on a trainer), the map of the ride will show an area off the coast of Africa (where the latitude and longitude are 0). This will be fixed soon when this learns how to deal with rides on trainers better.
This is the first of a series of features to make sharing rides better. Automatic sharing… continue reading
Improved power curve
31 May, 2012 by David JohnstoneAs of today you can see a lot more data on the power curve. Previously it only showed the all-time best powers, but now it can also show the best powers for any year, month or week.

If you’re not familiar with this graphic, it shows the highest average power achieved for all time periods. Therefore, it shows the highest average power sustained for five seconds, one minute, five minutes, twenty minutes, one hour and everything in between. It’s useful for seeing what one is capable of doing, and can indicate performance improvements when looked at over time.
On not holding data hostage
10 May, 2012 by David JohnstoneA good reason for continuing to use a system is because it works very well. A bad reason for continuing to use a system is because you have heaps of data stuck in it with no way to get it out. So, in the interest of openness, and in the general desire to make an exceptionally user friendly product, Cycling Analytics now allows users to download all the ride data that they have uploaded. Users can go to the profile settings page and download a big zip file containing all their rides in the format that they were uploaded in.
Introducing Cycling Analytics
7 May, 2012 by David JohnstoneWith the emergence of bike computers that record everything and allow for later analysis, not to mention the rise in popularity of power meters, cyclists have never before had access to so much data. All this data needs to be analysed somehow if it’s going to be of any use. The short story is that I wasn’t completely satisfied with what currently exists, so I made my own. Here it is.
Cycling Analytics is a website where cyclists can upload ride data and analyse it. I could spend a few paragraphs describing the functionality of the website, but it’s easier to just look at it. Here’s a ride I went on recently. From there, you can go to my list of rides, and there’s a few handy analytical tools lying around — a power curve, showing the highest average power sustained for all time lengths, and a training load table, which gives some indication of how much cycling one is currently doing. There’s a few nice things you can’t see without having an account, like the ability to automatically upload rides to Strava when they’re uploaded here.
I’ve been using this site for a little while now, and now you can too. For the moment it is free to use, but as of the 22nd of July it will cost $80/year. This site has a particular focus on power data because that data is more insightful than any other. Therefore, having a power meter is highly recommended, but not necessary. This currently only supports FIT files (which Garmin devices create). Support for TCX and SRM files is coming, as well as any other file formats that there is a demand for. You can check to see if your files are compatible with this tool.
There are many more features planned, so don’t think that the site will stay just like it currently is. In the near future there is a lot of work to be done improving what currently exists to make it nicer and expose more data to make the analytical tools more powerful. And I have a few more ideas…