Assorted updates
14 October, 2013 by David JohnstoneA variety of changes have happened recently. Highlights include improved summary data, UK units, power variability, power and heart rate zones charts in ride summaries, Flexicharts and API improvements, and account deletion. Read on for more details.
The way ride times are calculated has changed. Previously, there was duration and riding time, where duration was the length of ride from start to finish, and riding time was the time spent moving. These have been renamed to total time and moving time, and a new value called duration has been added, which is intended to be the best approximation of the actual length of the ride. Read How everything is calculated for more details about this and the rest of the summary data.
As a result of the ride duration changes, training load and TRIMP values have changed in some cases. When they have changed, they will be a few percent higher, and this in turn affects the numbers on the training load chart.
The variability of power output is now calculated and shown in ride summaries. As effective power takes high power outputs into account to work out a “this ride would be as hard as riding at this power continuously” figure, a ride with a constant average power will have the same effective power, but the more varied the power output, the higher the effective power will be relative to the average power. Consequently, variability is defined as effective power / average power, where a value of 100% requires a perfectly constant power output, and higher values will be seen when the power output is more variable.
The other change in ride summaries is that the heart rate and power zones are now displayed as a chart instead of a table. Moving the mouse over the chart shows information about each zone.

How everything is calculated
14 October, 2013 by David JohnstoneThere’s lots of numbers on this site, but it’s not obvious how many of them are calculated. In fact, even the simplest ones end up being a lot less simple when you think about it. Does average power include zeros? Does average cadence? And why are there three times for the ride? Read on and be illuminated.
- Total time — The time between the start of recording and end of recording. Simple, but misleading if your ride involves riding to work, working eight hours, and then riding home.
- Duration — The time between the start of movement and end of movement, with all gaps larger than three minutes reduced to three minutes. You are counted as moving when speed is above 3km/h, as GPS errors can creep in here, or when power is greater than zero. This is intended to be the closest approximation to how long the ride actually was, although there isn’t a perfect way of measuring this, as the time you want depends on what you want to know the time for. Thus, this is intended to be how long the ride was according to your body, and it is used to calculate training load and TRIMP, which both calculate how taxing the ride was based on the time and an intensity factor. Gaps aren’t completely eliminated, as they allow for recovery between efforts. Three minutes is a somewhat arbitrary cut-off point for gaps, but there is always going to be arbitrariness — for example: why should rolling down a mountain for 15 minutes count if you don’t do any pedalling?, or, what’s the difference between coming to a complete stop after a hard interval and rolling at 15km/h? Gaps are shortened below three minutes if the recording device was stopped for the duration of the gap. If there is no speed data, this is the same as total time.
- Moving time — The amount of time that you are moving. As with duration, you are counted as moving when your speed is above 3km/h (to cater for GPS errors) or when power is greater than zero. If there is no speed data, this is the same as total time.
- Distance — How far you went. This one’s easy.
- Climbing — How many metres/feet were climbed in the ride. This is actually quite difficult to properly define for reasons related to the… continue reading
The Cycling Analytics API
19 September, 2013 by David JohnstoneCycling Analytics now has an API. This provides a programatic interface to this website, which means other websites, mobile apps etc. can read, modify and create users’ data. This has been a work in progress for some time — observant users may have noticed the link to the developer page in the footer or the “developer mode” option in profile settings in the past few months — but it’s now ready for general use.

The API can be used for many things, such as mobile apps to record rides and directly upload them, websites that do novel things with ride data, scripts to automatically upload rides, and much more. The documentation is much more thorough, but here’s a few things worth noting:
- The first step in using the API is getting an authentication key, which effectively says “this user has given you permission to use the API on their behalf”.
- For personal use, authentication keys can be created in the API console (which is also useful for playing around with the API).
- There are much more convenient ways to get authentication keys if you are making something that other people are going to use.
- If those convenient ways of getting an authentication key are going to be used, an app must be registered. Developer mode must first be activated, and… continue reading
Garmin Vector mini review
11 September, 2013 by David JohnstoneThe Garmin Vector is finally out, and I have one. I’ve spent about an hour riding with it so far, so I don’t have any large scale data comparisons (you’ll need to wait for DC Rainmaker’s review for that), but I do have a few thoughts.

Installing it wasn’t too complicated, although I did watch a few of the videos, mostly to make sure I didn’t do anything silly, but they did explain what the washers were for (which is to create a gap between the side of the pod and the pedal).
Although my pedals came with the latest firmware, I had to use the updater to tell them that my crank length was 175mm. They default to 172.5mm, which can be changed with Garmin Edge 810 and 510 head units, but I only have a Garmin Edge 500, so I needed to install the program which connects to the Vector using the included ANT+ USB stick.
The main issue I have faced is that my FSA SL-K Light carbon cranks are right at the limit of how wide cranks can be with the pods. Apparently the Vector supports cranks up to 38mm wide and 15mm thick, and my cranks are about that wide.

Left/ride power balance metrics
11 September, 2013 by David JohnstoneJust in time for the Garmin Vector, Cycling Analytics now supports the left/right power balance metrics that some recent power meters produce.
The left/right power balance appears in three places.
Firstly, there’s an overall left/right balance for the entire ride in the ride summary. However, it’s a bit like average power in that it means something, but there are many situations where it doesn’t say as much as it could.
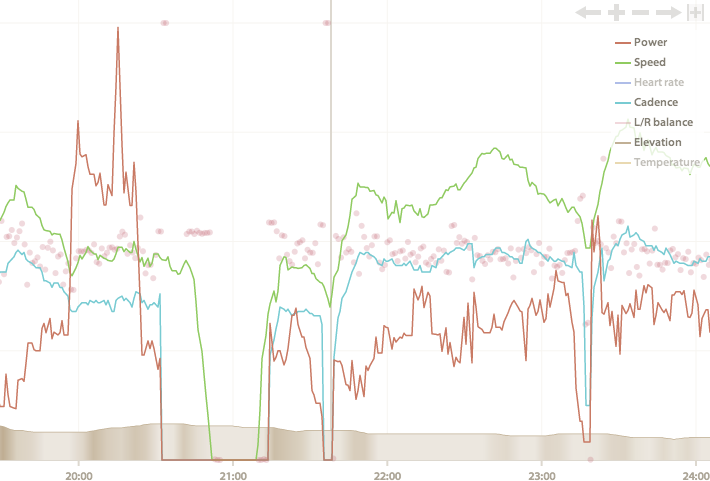
Secondly, the main ride chart shows the power balance as points. You’ll first need to click “L/R balance” in the legend to make it visible. The average is also shown for selections when they are made. Note that the centre grid line is at 50%, and the percentage refers to the proportion of power coming from the left leg (so pedalling with only the left leg will result in points on the top of the chart).
Finally, there’s a power versus left/right balance chart at the bottom of the page. This is an x-y scatter plot that shows the power and power balance for each second of the ride. This is useful as it gives a better understanding of what your power balance looks like.

Coach mode
17 August, 2013 by David JohnstoneAre you a coach wanting to use Cycling Analytics with your clients? Today’s new feature lets you link your account with your clients so that you can use their accounts as though you were logged in as them. That is, you can upload rides, add new FTP values, and do anything else related to viewing and modifying their ride and fitness data.

To make use of this, coach mode must first be activated. There’s a checkbox for this on the profile settings page. Once activated, a Coaching heading will be visible on the sidebar on the left. Athletes can then be added by providing either their email address (the one they use to log in to Cycling Analytics with), or their user ID (which is the number in URLs like www.cyclinganalytics.com/user/1000000). They are then sent an email that asks them to confirm that you are their coach. (They don’t need to activate coach mode themselves.)
All of your athletes are shown in a table on the coaching page:

Flexicharts improvements and new Strava uploading
14 August, 2013 by David JohnstoneFlexicharts were introduced last month as a way to make custom charts. A number of improvements have been made to them, so it’s now possible to chart multiple things on one chart, and they now have access to power curve and PWC data. Therefore, it’s now possible to make charts like:

This chart shows the best 5 sec, 1 min, 5 min and 20 min power output for each ride (as points) and each month (as lines). This chart is created with these commands:
>>> rides.power_curve(5).points({color: 'hsla(190, 78%, 35%, 0.2)'})
>>> rides.power_curve(60).points({color: 'hsla(260, 78%, 35%, 0.2)'}).on(-1)
>>> rides.power_curve(300).points({color: 'hsla(330, 78%, 35%, 0.2)'}).on(-1)
>>> rides.power_curve(1200).points({color: 'hsla(40, 78%, 35%, 0.2)'}).on(-1)
>>> rides.power_curve(5).group_by(month).aggregate(max).line({color: 'hsla(190, 60%, 70%, 1)'}).on(-1)
>>> rides.power_curve(60).group_by(month).aggregate(max).line({color: 'hsla(260, 60%, 70%, 1)'}).on(-1)
>>> rides.power_curve(300).group_by(month).aggregate(max).line({color: 'hsla(330, 60%, 70%, 1)'}).on(-1)
>>> rides.power_curve(1200).group_by(month).aggregate(max).line({color: 'hsla(40, 60%, 70%, 1)'}).on(-1)
The new functions used here are power_curve(seconds), which shows the highest average power for a given duration in each… continue reading
Create custom charts with Flexicharts
19 July, 2013 by David JohnstoneA number of people have asked for various charts and other bits of information to be displayed. I’ve been reluctant to add most of these, because they would make the interface more cluttered with things that most people don’t use. However, at the same time, these requests have been for things that are reasonable for some to want to see, so I never wanted to say “no” and leave it at that. Therefore, today’s new feature is a way to easily make custom charts, called Flexicharts.
Flexicharts can be accessed via the link in the analysis section of the sidebar on the left, right underneath “Zones”. Going to that page brings up a prompt which can be given commands to create charts, and some explanatory text.
To create a simple chart that shows the distance of each ride, enter rides.distance() into the prompt and hit enter. This will result in a chart like the following being created:

Instead of distance, many other aspects of the rides can be charted, including duration, average heart rate, training load and maximum power (there’s a complete list of these at the bottom of the Flexicharts page). Note that, at the moment, the units displayed are always metric, so the distance is displayed in kilometres, even if you’ve set… continue reading
Strava uploading is working again
6 July, 2013 by David JohnstoneEarlier this week Strava shut down their existing API without making a new one publicly available. That caused issues here, because that API was being used here to upload rides to Strava. In light of this, the Strava uploading feature has been remade to work with the “upload by email” feature that Strava still provides.
If you want to have your rides uploaded to Strava, you will need to go to the linked accounts page and add the email address you use to sign in to Strava. (You need to do this even if you already had your account set to upload rides to Strava.) When this is done, an email is sent from the email address you provide (fun fact: an email can say it comes from any email address) to Strava with the ride file attached, and sometime in the next ten minutes or so, the ride should appear on Strava.
This approach to uploading rides isn’t as good as the previous method, as it no longer provides direct feedback to Cycling Analytics about the upload so it’s impossible to show a link to the ride on Strava. This also means that the Strava ride management tool doesn’t work any more, as it relies on the API that used to exist. Hopefully Strava will one day make an API available to the public again, but based on their communication, it probably won’t be this year.
Supported file formats
18 June, 2013 by David JohnstoneHere is a list of file formats that Cycling Analytics currently supports.
FIT — The FIT, or Flexible and Interoperable Data Transfer, file format was developed primarily by Garmin and is used by most recent Garmin devices such as the Garmin Edge 510, Garmin Edge 810, Garmin Edge 1000, Garmin Forerunner 310XT and many more. FIT files of rides are supported by Cycling Analytics (that is, if you record a ride, the FIT file should be supported; the FIT file format is vastly more complex and allows for all sorts of things beyond what bike computers create). If possible, set your device to record in one second intervals for best results.
GPX — The GPX, or GPS eXchange, format is a simple format designed to store GPS tracks, but can be extended to store information like heart rate and cadence.
TCX — The TCX, or Training Center XML, format is similar to GPX, but more advanced, and was developed by Garmin.
SRM — SRM files are created by SRM PowerControl head units. Currently, only files from PowerControl 7 devices are supported. Support for older formats will come, but I don’t have any files to test it against (get in contact if you have some). One caveat is that all rides are currently stored with a recording interval of one second in Cycling Analytics, so SRM files with a recording interval of 0.5s have every pair of records joined together (this will be changed someday).
DAT — DAT files are produced by Wattbike indoor bikes. Wattbikes record additional in-depth information about pedal strokes, although Cycling Analytics doesn’t yet do anything with this. The ride date is not contained in the file, so it must be somewhere in the filename in the format DDMMYY or YYYY-MM-DD-HH-MM-SS (i.e., “220714.dat”, “z3-workout-220714.dat” or “2014-07-22-08-35-22.dat”). If the filename doesn’t contain a date, the current date is used.
PWX — The PWX file format is similar to TCX and was developed Peaksware.
CSV — There are many different ways that CSV (or comma separated values) file formats are structured. Currently, CSV files from Cyclops Joule and iBike Newton devices are supported. For CSV files that don’t contain dates, the filename will be searched for a date as with DAT files, or the current date will be used.
BIN — BIN files produced by Cycleops Joule devices are supported.
DB — DB files are produced by Pioneer head… continue reading